Occupant — AI Compute Benchmarks
Public data infrastructure for AI model pricing, compute deflation tracking, and market intelligence.
The Bloomberg Terminal for AI Compute
Nobody knows what AI actually costs. Pricing is fragmented across providers, resellers, and model routers. Procurement teams are buying blind. Researchers are budgeting on vibes. Government buyers have zero benchmark for what a “fair deal” looks like.
Occupant fixes that. It’s a public price index for AI compute — daily-updated, methodology-transparent, free to use, and built to serve anyone who needs to know what this stuff actually costs.
What It Tracks
2,300+ models. Updated daily. Zero paywall.
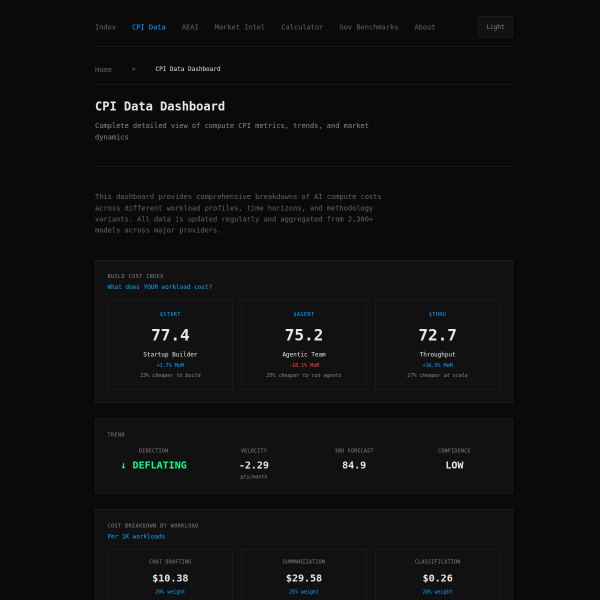
Compute CPI
A price deflation index answering the only question that matters: is compute getting cheaper, and how fast? Tracks cost trajectories across capability tiers so you can plan budgets against real data instead of vendor promises.
AI Economic Activity Index (AEAI)
Market activity proxy measuring volume, diversity, and structural shifts in AI usage. Think of it as the pulse check for whether the market is consolidating or fragmenting.
Market Intelligence
Sabermetrics for AI models — rankings, performance tiers, premiumization vs. commoditization signals, provider market share, pricing strategy analysis, and price volatility alerts.
Government Procurement Benchmarks
Fair market price ranges and vendor evaluation questions built specifically for public-sector buyers. Includes downloadable procurement worksheets. Because no government CTO should be negotiating a compute contract without independent pricing data.
Cost Calculator
Interactive estimator for budgeting AI spend based on your actual usage patterns and provider pricing. No signup required.
Built to Last, Built for Free
Occupant runs on a deliberately simple architecture: no database, no server, no login, no tracking.
- Daily cron job fetches pricing from OpenRouter, LiteLLM, Chatbot Arena, and pricepertoken.com
- Python scripts compute CPI, AEAI, and market intelligence indices
- GitHub Actions regenerates JSON datasets and deploys to GitHub Pages
- Static HTML + vanilla JS renders dashboards client-side
- PWA with service worker for offline access
Total hosting cost: zero. Total tracking: zero. Price discrepancies exceeding 10% trigger manual review before publication. Full transparency disclosure published at /tardigrade.html.
Every dataset is available as downloadable JSON under /data/ for anyone who wants to build on it.
Who It’s For
Procurement and finance teams check headline CPI/AEAI numbers, pull fair-deal ranges from the gov benchmark page, estimate spend with the calculator, and download worksheets for vendor evaluation.
Researchers and market watchers track CPI time series for deflation trends, analyze market structure shifts, reference the glossary for metric definitions, and pull JSON datasets for their own analysis.
Developers and analysts fetch JSON directly and integrate into internal dashboards and budgeting models.
Why It Matters
The AI market has a transparency problem. Vendors set prices, buyers accept them, and nobody has independent data to push back. Occupant is public data infrastructure — the kind of thing that should exist as a utility, not a SaaS product with a pricing page.
It proves you can build credible, daily-updated data products on static architecture with zero operational cost. And it gives every buyer — from a startup founder to a federal CTO — the data they need to negotiate from a position of knowledge instead of faith.